Daily news on environment in Ireland
Provided by AGPEuro area and national balance of payments and international investment position statistics
This biennial report provides a quality review of the national balance of payments (b.o.p.), international investment position (i.i.p.) and international reserves template of the Eurosystem (international reserves), as well as the associated euro area aggregates.[1] The report thus fulfils the formal requirement for the Executive Board of the European Central Bank (ECB) to inform its Governing Council of the quality of these statistics, as set out in Article 6(1) of Guideline ECB/2011/23 (hereinafter, the ECB Guideline on external statistics).[2] Furthermore, the report provides information supporting the macroeconomic imbalance procedure (MIP) data quality assurance process, as laid down in the Memorandum of Understanding between Eurostat and the European Central Bank/Directorate General Statistics on the quality assurance of statistics underlying the Macroeconomic Imbalances Procedure (the MoU).
The main principles and elements guiding the production of ECB statistics are set out in the ECB Statistics Quality Framework (SQF) and quality assurance procedures, which are published on the ECB’s website.[3] This report therefore provides a quality analysis of the statistical output covering: (i) methodological soundness; (ii) an assessment of compliance by national central banks (NCBs), in terms of timeliness and coverage; (iii) the reliability of the statistical data; (iv) internal consistency of the statistics; (v) external consistency and coherence; and (vi) asymmetries (intra-euro area and bilateral asymmetries).
The descriptive and quantitative indicators used throughout this report are based on quarterly and monthly data transmitted up to 31 October 2025. The last reference periods included in the analysis are the second quarter of 2025 for quarterly data and June 2025 for monthly data. Supporting tables and charts are provided in Annex 1, while details of how the indicators are computed can be found in Annex 2.
Statistical developments
This section highlights some of the statistical developments that have occurred since publication of the Quality Report 2023.
The 15th edition of the External Statistics Seminar was held in Frankfurt in December 2024, as part of the European System of Central Banks (ESCB) statistics training programme. The seminar was organised by the ECB, with contributions from various business areas. It was aimed at enhancing the participants' understanding of euro area and EU methodologies and practices in external statistics, along with ECB reporting requirements.
In March 2025 the International Monetary Fund (IMF) released the seventh edition of the Integrated Balance of Payments and International Investment Position Manual (“BPM7” or the “Manual”), updating global standards for external sector statistics. This edition addresses significant changes in the global economy, including evolving economic interconnectedness, digitalisation and financial innovations. Data presented in this Manual continue to follow BPM6 standards.
In July 2025 the statistical release on the euro area quarterly b.o.p. and i.i.p. introduced additional breakdowns of portfolio investment debt securities positions. Further information was made available in a dedicated ECB Data Portal Blog post. Additionally, the External Statistics Dashboard on the ECB’s website was complemented with data on bilateral economic and financial linkages between the euro area/euro area countries and the United States (see the Dashboard tab “Focus on the United States”).
At its July 2025 meeting the ESCB Statistics Committee (STC) endorsed the “Medium-term Strategy for External Statistics”, ensuring the coordinated implementation of the new international statistical standards (System of National Accounts (SNA)/European System of Accounts (ESA) and BPM7) in Europe by the end of the decade.
The ESCB has progressed with its activities to enhance monthly b.o.p. statistics, given the importance of high-frequency data for the ECB’s decision-making bodies. The ECB is organising webinars on specific aspects of b.o.p. and i.i.p. statistics compilation in which national experts can share best practices with experts of interested countries seeking to implement similar approaches to overcome deficiencies existing within their own systems.
In July 2025 the ECB released an updated electronic version of the EU Balance of Payments and International Investment Position statistical sources and methods (the B.o.p. and i.i.p. e-book). The update included additional information on Special Purpose Entities (SPEs) and on an agreement put forward by the Working Group on External Statistics (WG ES) on the recording of corporate restructuring events, particularly in terms of transactions and other changes in volume, based on a harmonised interpretation of the current international statistical standards.
Within the ESCB, the WG ES and the Working Group on Financial Accounts and Government Finance Statistics (WG FGS), along with other STC substructures, are working together on the following common issues:
- eliminating the remaining inconsistencies between the national b.o.p and i.i.p. statistics and the rest of the world (RoW) account and supporting the review of the SNA and Balance of Payments Manual (BPM);
- implementing the plan for compiling data on foreign-controlled non-financial corporations, as approved by the STC in June 2023.
Further improvements to data quality have been made by countries in capturing the activities of SPEs (e.g. Malta has supplemented the annual survey with a new administrative data source and Luxembourg has increased the coverage). Cyprus and Malta have increased consistency over time by reducing breaks. Spain has started to correctly classify trade credits between companies engaged in a direct investment relationship under direct investment rather than other investment, and Greece has started to classify trade credit instruments that were previously misreported under loans. Other countries have included additional estimations to improve the overall quality of their statistics (e.g. France has included an estimation of euro area banknote holdings abroad).
However, there is still room for further improvement in the various quality dimensions analysed in this report. For example, in terms of methodological soundness, despite significant improvements, Malta and Cyprus continue to face certain challenges in working to improve the general quality of their data, enhance SPE data collection (e.g. geographical details) and eliminate breaks in the data.
In terms of functional classification, a number of countries are not yet able to classify as direct investment (the appropriate functional category) transactions and related positions in debt securities between companies engaged in a direct investment relationship. Furthermore, the recording of trade credits between companies in a direct investment relationship under other investment instead of under direct investment remains an issue for Luxembourg.
With regard to internal consistency, most countries provide the ECB with fully consistent data. However, Malta needs to ensure regular compliance with the validation and integrity rules for quarterly b.o.p. and i.i.p. data, while Germany needs to ensure the proper geographical allocation of all transactions and positions and avoid the use of “W19 Rest of the World (non-allocated geographically)”.
With regard to consistency and coherence with other datasets, b.o.p. and i.i.p. data are broadly consistent with other datasets, thus ensuring comparability across statistical domains. However, it continues to be of the utmost importance that all countries follow the agreed steps to ensure full consistency vis-à-vis balance sheet item (BSI) statistics and sectoral accounts. In terms of other datasets, the ECB encourages b.o.p. and i.i.p. colleagues to interact with their counterparts to structurally reduce discrepancies and/or reconcile and document differences between datasets where there are objective methodological differences.
Table 1 below provides a list of notable issues affecting certain euro area countries, as well as the scope for improvement, based on the analysis carried out in the following chapters.
Table 1
Notable issues and scope for improvement (for euro area countries)
Notes:
1) In accordance with the BPM6 standards, margins on buying and selling financial assets should be included in the service account. However, owing to the complexity of including this item in the accounts, the WG ES, in cooperation with other international organisations, has investigated approaches to defining best practices by providing specific guidance to enhance the estimation of this financial service. The outcome did not reach a sufficiently clear conclusion and the methodological work now continues as part of the BPM6 update. The countries excluded conducted studies on the gross national income materiality of margins on buying and selling financial assets and could demonstrate that those services are not material.
2) The implementation of the full accrual principle in the portfolio investment liability might take more time, owing to the complexity of the issue.
3) For France, a review is currently underway as part of the preparatory work for the transition to BPM7.
4) Germany assesses that intragroup financing via debt securities is a phenomenon that is almost non-existent.
5) For Greece, intragroup financing via debt securities is assessed by the FDI survey, but the amounts seem to be negligible and therefore it is assumed that the phenomenon is almost non-existent.
6) France assumes that intragroup financing via debt securities is almost non-existent. Changing this assumption would be costly for a generally negligible impact on the overall balance of payment.
7) Some Luxembourgish financial institutions provide the Banque centrale de Luxembourg with statistical forms including hybrid financial products, which would be either equity or debt instruments. After carefully analysing the reports, the NCB concluded that the correct classification was either Direct investment / Loan or portfolio investment / Debt securities.
8) France has reported assets on F6 stocks and flows for non-financial corporations up to Q4 2019. F6 includes non-life insurance, life insurance and annuities, pension schemes and standardised guarantees. As regards pension schemes, these are of very limited relevance in France, given the specific features of the French pension system, which is overwhelmingly based on mandatory statutory schemes, while supplementary retirement savings remain small (for reference see link)”.
9) Latvia has improved the estimation models by integrating securities holdings statistics data and by using BIS mirror data and mirror data on real estate.
10) 2026 Joint ECB-Eurostat report on the inconsistencies in National Accounts and Balance of Payments concerning quarterly financial and non-financial accounts.
11) For France, differences in positions are long-standing and structural. There are differences in the valuation of shares: at market value for portfolio investment in the i.i.p. and at book value in the MFI statistics. Differences in FDI are likely owing to valuation effects.
12) For France, the data source for insurance companies holding securities will be in the future be taken from the insurers’ policy portfolio rather than custodian data, which is expected to reduce the discrepancies.
Statistical issues affecting MIP indicators
The ECB, in collaboration with Eurostat, has continued to monitor specific quality aspects of the statistical outputs, as required under the MoU. In fact, some of the quality dimensions addressed in this report are also relevant for assessing the quality of data for MIP purposes (see, for instance, methodological issues A1 to A9 and A11, D3, E1 and F1E1 in Table 1). Some of the recommendations set out in Table 1, such as those related to the reconciliation of stocks and flows (A8), do not affect the computation of the main MIP indicators but do play a role in the calculation and analysis of auxiliary indicators. However, the particular features of the annual data and the MIP process, as well as the scope of the ECB’s responsibilities under the MoU (for those of the 27 EU Member States (EU27) that have designated their respective NCBs to produce the b.o.p. and i.i.p. datasets), create special analytical needs. In particular, longer time series (up to 15 years) are necessary for an accurate construction and analysis of the main MIP scoreboard indicators.
For more information on the assessment of data quality for MIP purposes, please see the joint Eurostat/ECB summary report that assesses the quality of all statistics underpinning the MIP published each year on the CMFB website. For further information on the MIP indicators, please see Annex 3 to this report
This biennial report provides a review of the quality of statistics on the balance of payments (b.o.p.), the international investment position (i.i.p.) and the Eurosystem international reserves template (international reserves). It thus fulfils the formal requirement for the ECB’s Executive Board to inform the Governing Council of the quality of these statistics, as laid down in Article 6(1) of the ECB Guideline on external statistics. Furthermore, the report provides information supporting the MIP data quality assurance process, as required under the MoU. The report follows the recommendations adopted by the CMFB in this domain.
The focus of the report is on national data for the euro area countries and euro area aggregates. Data for all EU27 countries are presented in the annexed tables.[4]
In compiling their statistics, the euro area countries followed the sixth edition of the IMF Balance of Payments and International Investment Position Manual (“BPM6”) and take into consideration the ECB’s guideline as well as the agreements reached by the STC (and its respective substructures).
Scope of data coverage and structure of the report
This report analyses a number of aspects by which data quality can be measured. These include: (i) a review of methodological issues on which national compilers diverge from statistical standards or need to enhance their statistical procedures; (ii) an assessment of compliance by NCBs, in terms of timeliness and coverage, with their obligations to transmit data to the ECB; (iii) the reliability of the statistical data; (iv) the internal consistency of the statistics, particularly over time, across frequencies and between accounts (net errors and omissions); (v) external consistency and coherence, i.e. vis-à-vis other statistical domains and datasets, namely foreign trade statistics, euro area sector accounts, monetary financial institution (MFI) balance sheet statistics (including money market funds (MMFs)), investment funds (IF) statistics, insurance corporations and pension funds (ICPF) statistics and securities holdings statistics (SHS); as well as (vi) asymmetries at the level of the intra-euro area aggregates and bilateral asymmetries between euro area countries.
The analysis covers monthly and quarterly data. Section 3 (timeliness and punctuality), Section 4 (data and metadata availability) and Section 6.1 (validation and integrity rules) focus on two years of observations (from July 2023 to June 2025, for monthly data, and from Q3 2023 to Q2 2025, for quarterly data) covering the period since the Quality Report 2023. Section 5 (accuracy and reliability) analyses of two years of revisions (from April 2023 to March 2025, for monthly data and from Q2 2023 to Q1 2025, for quarterly data), while the remaining sections use three years of data (from Q3 2022 to Q2 2025)[5].
The last data vintage used throughout the report is that available on 31 October 2025 (in line with the MIP cut-off date for the 2025 exercise), and the country coverage is mostly limited to the euro area countries, although the annexed tables provide information on the quality of data for all EU27 countries.
Methodological soundness means that the concepts and definitions used to compile b.o.p. and i.i.p. statistics are broadly in line with the principles and guidelines outlined in the BPM6 and take into consideration the ECB Guideline as well as the agreements reached by the STC (and its respective substructures).
One of the key elements of compiling consistent data is to adhere to the agreed standards and to described deviations in a transparent manner. A detailed description of the data sources and compilation methods used by all EU27 countries is provided in the B.o.p. and i.i.p. e-book. The assessment included in the current section of the report is based on that publication, which was last updated in July 2025, as well as on regular contacts held by the ECB with national compilers on general data quality issues.[6]
2.1 Residency
The residency of institutional units should be defined in conformity with the BPM6, particularly regarding whether they have a predominant centre of economic interest in the country concerned. SPEs are deemed to be resident in the economy in which they are incorporated.
Most euro area countries correctly apply the residency concept. However, several countries host a large population of SPEs and therefore face certain challenges in achieving full coverage, and sometimes even in identifying the residency of certain entities with different fiscal and legal residencies.
In particular, the compilation of SPE data in Malta was previously based solely on administrative sources (at an annual frequency with a delay of at least three years, and with very limited information for identifying the correct functional category, the financial instrument and the geography of the counterpart). The compilation of Maltese i.i.p. statistics has now been improved with new administrative source data, supplemented by an annual survey. Revisions reflecting these changes from Q1 2017 onwards were implemented in 2023 and 2024, applying a level shift in direct investment and portfolio investment positions.
In September 2021 Cyprus improved the geographical allocation for selected counterparties for data from 2017 onwards, albeit mainly for FDI equity, thereby inserting a break in the series that has not yet been addressed. Furthermore, limitations still apply to the geographical details for SPEs in FDI debt and other investment.
The Banque centrale du Luxembourg estimates that the total coverage rate for Luxembourgish captive financial institutions is now around 92%, given that entities with balance sheet assets of between €300 million and €500 million (and more) were taken onboard from September 2020, in addition to further administrative sources from 2023.
The Netherlands currently has almost complete coverage for annual figures. However, quality issues persist with the preliminary quarterly figures owing to their reliance on grossing-up methods and the connection between the new quarterly data and the monthly estimates. These issues call for further attention in order to safeguard the quality of the high-frequency data.
2.2 Classification
The FDI breakdown by debt instruments, required since March 2021 under Guideline ECB/2018/19, shows that at the end of June 2025 the main lending instruments used between companies in an FDI relationship are loans (around 80%) and trade credits and advances (around 15%). For debt securities, only a few countries report figures larger than 1% of total intercompany lending: Cyprus, Finland, Malta and Portugal; along with Austria and Ireland on the liabilities side. Germany, Spain,[7] France, Greece, Luxembourg, Latvia and Slovenia report zero values. For Malta, debt securities have a relevant weight in asset figures as they make up around one quarter of total intercompany lending and account for 90% of the euro area aggregate. A methodological deviation in the classification of debt securities might have a relevant undesirable impact for the compilation at the euro area level, owing to the residual approach used to calculate euro area portfolio investment liabilities. National compilers should therefore continue to assess the relevance of this issue and implement a plan to address it.
Trade credits and advances between companies engaged in a direct investment relationship are included under other investment by Luxembourg. Spain and Greece started to allocate them appropriately under direct investment from September 2024. Germany classifies all transactions and positions in loans/deposits as other investment if at least one of the counterparts with a direct investment relationship is an MFI.
Reverse direct investment as well as transactions and positions between fellow enterprises in equity are not fully recorded under FDI but are considered negligible in most euro area countries.
Malta has started to allocate SPE debt securities assets under portfolio investment or direct investment according to a new data source that makes it possible to identify the relationship with the debtor. Most of the equities previously considered to be portfolio investment assets have been now reclassified under direct investment, and Malta is therefore now compliant with the ECB Guideline on external statistics, which specifies that 85% of portfolio investment data should be collected on a security-by-security basis. This classification should also be applied to data prior to Q1 2017[8].
In many countries, service margins on buying and selling financial assets are not recorded separately from the financial transactions that generate them due to the complexity of estimating this item. Nonetheless, for many countries this service item has been assessed not to be material.[9] France included an estimation for these services in the 2024 benchmark revisions while Luxembourg is still exploring possible data sources and calculation methods for the import side.
2.3 Coverage
In 2018 the WG ES, in cooperation with the WG FA, mandated a task force to issue recommendations on data sources, data collection and compilation methods for financial derivatives. In December 2020 the STC approved the development of national action plans to address these recommendations in terms of data coverage, statistical recording, ensuring stock/flow consistency, recording of post-trading activities and the use of data derived from business accounting. Non-structural adjustments (review of data collection and compilation practices without a major structural impact) were to have been implemented by September 2022, while structural adjustments, such as changes in main data sources, were expected to be implemented during the 2024 benchmark revision. However, in general, there is scope for increasing the quality of financial derivatives data and this should be achievable with implementation of the structural adjustments to be incorporated into the national plans. Cyprus, Estonia[10], Croatia[11], Luxembourg and Malta[12] do not record any transactions and positions in financial derivatives for the government sector. Slovakia only reports positions and revaluations.[13] France[14] reports positions and other volume changes. France only reports positions for the central bank and non-financial corporations.
In April 2015 the STC approved a new treatment for recording transactions and positions in euro currency for b.o.p. and i.i.p. statistics. Most euro area countries have been following the STC guidance in a timely and accurate manner. In June 2025 France started to estimate euro currency holdings abroad (stocks and flows) from Q1 2022 onwards, although these estimates do not seem to be included in total other investment. Greece also started recording stocks in the i.i.p. consistent with the transactions already recorded from Q1 2022 onwards.[15] Malta does not currently incorporate any estimates for euro currency holdings abroad (stocks and flows). The Latvian estimation of currency holdings abroad also requires corrections (for 2014 data that would carry over to the present) and updates to the assumptions, in particular from the Q1 2018 reference period onwards.
Since March 2021 the reporting of a more granular sector breakdown has made it possible to (i) identify the activity of insurance corporations and pension funds resident in Europe; and (ii) more effectively assess the coverage of cross-border insurance, pension schemes and standardised guarantee schemes (F6) assets in the other sectors of the economy. Ireland has completed the reporting of F6 assets for insurance corporations and pension funds from 2013 and Malta from Q1 2017. However, they do not report F6 assets for any other sectors, similarly to Lithuania and Luxembourg. France[16] does not cover F6 assets for any sector of the economy. Greece does not record transactions, only reports the stocks (assets and liabilities) of insurance corporations and pension funds. Finland reports transactions and positions of F6 assets for households and non-financial corporations from Q1 2021 onwards and includes derived liabilities of insurance corporations from life insurance policy premiums paid by non-residents.
Furthermore, Malta has extended the period in which a detailed breakdown of equity is reported (into listed and unlisted shares, other equity and IF shares) to Q1 2017. However, for FDI figures, Malta reports investment in IF shares (F52), which, following the WG ES agreement, should not be considered an instrument to be included under FDI. These investments should be reclassified to portfolio investment.
In general, most countries have difficulties producing an accurate estimate of cross-border transactions and positions for the non-financial sector (particularly for households). This under-coverage is believed to be particularly relevant for assets held outside the euro area, including those held with foreign custodians. Most euro area countries use mirror data from: (i) the BIS locational banking statistics and the MFI balance sheet statistics from other euro area countries, to cover deposits and loans vis-à-vis non-resident banks; and (ii) “third-party holdings” data collected for SHS to improve estimates for securities when the custodian is in another euro area country. The countries that do not use any sources to enhance their estimates of household assets are continually encouraged to integrate mirror data (reported by other NCBs) available for their country and to incorporate this information into their national data where appropriate.
From March 2021 onwards assets held by households and by non-profit institutions serving households (NPISHs) are reported separately for the b.o.p. and i.i.p., thus ensuring a better assessment of the coverage. Ireland is the only country that does not report any portfolio holdings by households and NPISHs. Compared with the Quality Report 2023, the Netherlands now includes securities held by households with custodians outside the country. Additionally, Germany has so far not collected information on securities (positions) held in custody outside the euro area by non-bank corporations. The foreign assets of German insurance corporations held abroad have been incorporated into German i.i.p. statistics since December 2021.
Many countries also have difficulties covering cross-border real estate holdings, in particular those owned by resident households. To complement the available information, the WG ES started to collect bilateral data in 2019 to be used as mirror data by compilers to cover resident holdings in other EU Member States. With regard to the figures currently reported, France, Malta[17] and Slovakia still do not include estimates of stocks and transactions for household cross-border real estate assets.
Income attributable to investment fund shareholders may be estimated using information available in the Central Securities Data Base (CSDB) or other reliable sources. Euro area holders seem to underestimate this income, in particular the holders of Irish and Luxembourgish investment funds (IFs). Owing to the residual approach used to calculate euro area investment income debits, this underestimation results in an overestimation of the euro area investment income of IFs attributable to non-euro area shareholders (extra-euro area debits). Recurrent underestimation of the received income attributable to shareholders from euro area IFs is seen in Austria, Belgium, Cyprus, Germany, Estonia, Croatia, Ireland, Luxembourg, Latvia, Malta and Slovakia; and needs to be addressed rapidly.
2.4 Other methodological issues
Germany estimates accrued interest for debt securities under portfolio investment income on a security-by-security basis, but no equivalent entry is imputed for the underlying instrument in the financial account.
For the Netherlands, the intra/extra-euro area breakdown of the i.i.p. data was not very plausible in the past given that large other volume changes were usually recorded with opposite signs vis-à-vis intra/extra-euro area counterparts. More recently, new methods have been put in place to address the quality of preliminary quarterly figures owing to the grossing-up methods used. Those methods have improved the geographical allocation and the stock/flow reconciliation.
In its compilation of external statistics, Germany generally uses two distinct data sources for transactions and positions respectively. This lack of integration in the sources may result in discrepancies that are reported under other changes in volume, which are particularly sizeable for IF shares in portfolio investment liabilities. A more integrated compilation would be desirable.
In the case of Ireland, the monthly estimate for goods applying the community concept does not display the expected seasonal pattern for exports and imports for first quarter of 2016. It is worth mentioning that significant improvements have been made compared with the previous quality report.
The quality of the monthly Cypriot, Dutch and Irish data has a negative impact on the general quality of the monthly euro area aggregates. They usually show either consistency problems with the reported quarterly data or an unreliable distribution of the quarterly transactions. Ireland does not systematically include the most up-to-date monthly information available in other monthly datasets, such as BSI or Investment Fund statistics (IVF), and Cyprus allocates FDI quarterly financial transactions and related income to the last month of each quarter.
Croatia and Estonia[18] systematically report zero monthly transactions in assets issued by MMF shares in their first estimates (vis-à-vis intra- and extra-euro area counterparts).
Payments statistics (collected under Regulation ECB/2020/59 amending Regulation ECB/2013/43) can be integrated into the b.o.p compilation systems either as a primary or as a complementary data source. National compilers should investigate ways in which this data source can complement or enrich existing data sources, particularly for the compilation of travel and other accounts in the balance of payments.
Article 3 of the ECB Guideline on external statistics sets the requirements for the timeliness and punctuality of data transmission. Infringements of these requirements are recorded as non-compliance cases.[19]
For the data transmissions covered in this report (reference periods: from July 2023 to June 2025, for monthly data, and from Q3 2023 to Q2 2025, for quarterly data), most of the countries made data available according to the agreed timetable. The few cases of non-compliance with completeness reported below are in line with the information contained in the annual compliance reports prepared for the ECB Governing Council.
Quarterly balance of payments and international investment position / other flows:
- for the reference period Q2 2024: the Banque National de Belgique transmitted data with a delay of three working days;
- for the reference period Q2 2024: the Central Bank of Cyprus transmitted data of an acceptable quality with a delay of five working days;
- for the reference period Q2 2024: Hrvastka Narodna Banka transmitted data for other changes with a delay of one working day;
- for the reference period Q2 2024: the Central Bank of Malta transmitted data with internal validation errors that were not addressed within the production window; corrections were transmitted with a delay of 21 working days.
Monthly reserve assets:
- for reference period October 2024: Banque de France transmitted data with a delay of one working day.
Data publication was not affected by the non-compliance cases and was carried out in line with the ECB’s Statistical calendars, published on the ECB’s website.
The compliance infringements set out above were ad hoc cases and did not require follow-up measures.
4.1 Completeness
Completeness is assessed based on the mandatory series in accordance with the ECB Guideline on external statistics in force in the period under analysis. For this quality dimension, tables are not included in the report, given that the appropriate indicator (average completeness ratio) would, in most of the cases, show completeness equal or close to 100%.
Under the ECB Guideline on external statistics, the data must “be accompanied by readily available information on single major events and on reasons for revisions, when the magnitude of the change to data caused by such single major events or revisions is significant […]”. National compilers are therefore required to make regular and consistent use of the metadata template in all production cycles.
Instances of information on single major events (above the threshold of €3 billion) not being reported (or being absent) despite being relevant for the euro area aggregate are also treated as non-compliance cases.
In general, for the review period, the metadata information exchanged with national compilers has been of sufficiently high quality to make it possible to produce the euro area aggregates and to explain major developments in those aggregates. Additionally, countries have responded to ECB requests for further details within the given deadlines.
The ECB welcomes further efforts to improve the accuracy and level of detail of the metadata transmitted to the ECB. It also encourages euro area national compilers to exchange information with other euro area compilers under the existing arrangements, for instance in the context of the FDI Network and the Asymmetry Resolution Mechanism (ARM), to further improve the data quality of the b.o.p. and i.i.p. statistics.
4.2 Accessibility
Accessibility refers to the conditions under which users can obtain, use and interpret data, ultimately reflecting how straightforward it is to access the data and the extent to which confidentiality constraints hamper analytical work.
In line with the ECB’s legal framework on data confidentiality,[20] all national data must be transmitted with a flag indicating their respective levels of confidentiality. The ECB encourages national compilers to make as much data available as possible to final users (i.e. by marking observations as being “free for publication”) and to ensure that statistical confidentiality flags are used appropriately and not to mask data quality issues.
According to the ECB Guideline, each country should make available to the final user a set of quarterly b.o.p and i.p.p. data.[21] The below percentages are calculated for the quarterly b.o.p. and i.i.p. data for the reference period from Q3 2023 to Q2 2025.
Most euro area countries flag as “free for publication” more than 90% of the subset of the publishable datasets releasable by ECB to the general public.[22] Belgium, Greece, France, Croatia, Italy, Latvia, the Netherlands, Slovenia and Slovakia release 100% of this dataset. Only Germany, Luxembourg, Malta, Austria and Portugal flag as “free for publication” less than 90% of either the quarterly b.o.p. or i.i.p. datasets.
Full monthly b.o.p. datasets were flagged as “non-publishable” or “confidential” by Ireland, Cyprus and the Netherlands (see Table A.1.1.1 in Annex 1).
With regard to the full extent of quarterly data transmitted to the ECB (of which the publishable subset is only a small portion), Germany, Spain and Luxembourg released more quarterly b.o.p and i.i.p. data to the public compared with the amount observed in the Quality Report 2023. More than 90% of the required quarterly b.o.p. data was made available to final users by 13 euro area countries and 14 euro area countries did the same for the quarterly i.i.p. data (see Table A.1.1.1 in Annex 1).
4.3 Clarity
Clarity refers to the “information environment” of the data, i.e. whether the data are accompanied by relevant and pertinent metadata, illustrations (such as charts), information on their quality, potential limitations as to their use and background information (sources and methods).
The ECB publishes the b.o.p. statistics (monthly and quarterly) and i.i.p. statistics (quarterly, including the data for revaluations and other changes in volume) for the euro area as a single economic area. Twelve monthly press releases and four quarterly statistical releases outlining the latest data and relevant economic developments are published through wire services and on the ECB’s website. Furthermore, dissemination dates for all these press releases are announced at the beginning of each calendar year in the ECB’s Statistical calendars.
The concepts and definitions used in the euro area b.o.p. and i.i.p. statistics are in line with international statistical standards. The B.o.p. and i.i.p. e-book is aimed at providing users with an overview of the main features of the b.o.p. and i.i.p. methodological framework and of the data sources and compilation methods used by the ECB (for the euro area) and by each of the EU27 countries.
The data can be accessed through the ECB Data Portal, the Main items of the euro area balance of payments interactive statistical report or through the data visualisation Dashboard. Furthermore, the ECB has a Statistical Information Request facility to help external users of statistics to access and analyse the data.
The annex on clarity presents a summary of national practices for data and metadata accessibility. Similar to the ECB, all euro area countries provide technical facilities for downloading their data in different formats (in Excel tables, CSV files, PDF documents or through interactive statistical databases). Furthermore, most euro area countries have statistical and/or economic bulletins providing a visual representation of the data in the form of charts, graphs and/or tables. Most euro area countries publish regular press release updates on their websites on a monthly and/or quarterly basis. Last but not least, all countries provide extensive information about their institutional environment and statistical processes in the B.o.p. and i.i.p. e-book, as well as on their national websites.
This section reviews the stability of the data in terms of revisions to the “first assessment” or “first vintage”. In general, revisions are necessary to improve the accuracy of the data, given that first assessments may be based on incomplete, late or erroneous responses by reporting agents. However, major recurrent (biased) revisions may indicate low quality of data sources and/or methods that need to be addressed. Conversely, minimal or no revisions does not necessarily mean that the first assessment was of a high quality; it may simply indicate a national preference for not revising the data.
In the report, different indicators are applied depending on the features of the time series in question. Two basic types of indicators are used.[23]
- Directional stability/reliability indicators measure how frequently first assessments are revised in the same direction (the upward revisions ratio and the directional reliability indicator).[24]
- Relative size indicators measure the difference between the first and last estimate. The difference can be measured (i) in relation to the underlying series when strictly positive (the symmetric mean absolute percentage error –SMAPE), or (ii) in relation to a reference series such as GDP or the underlying outstanding amounts for b.o.p. financial transactions (the mean absolute comparative error – MACE). In the case of non-strictly positive (net/balance) time series, revisions cannot be properly related to the series value itself because the observations may have different signs and, more importantly, the value of the series may be close to zero. The indicator used for net/balance series is therefore the net relative revisions (NRR) indicator. The NRR indicator measures the absolute revisions in relation to the average underlying gross flows for current account items and the average positions of assets and liabilities for financial account transactions and positions. Owing to the different denominators employed, the SMAPE, MACE and NRR indicators are not directly comparable.
When assessing accuracy and reliability, the indicators included in this report use a window of two years (reference periods: from Q2 2023 to Q1 2025, for quarterly data, and from April 2023 to March 2025, for monthly data).[25] The counterpart area is always the RoW in the main body of the report, but the annexes may present figures for other geographical counterparts.
In general, the revisions recorded in the reference period did not fundamentally differ from those recorded in the equivalent period analysed in the Quality Report 2023. However, since the publication of the last version of this report, most countries (with the exception of Luxembourg) have implemented major national accounts (NA) and b.o.p./i.i.p. benchmark revisions,[26] supporting the alignment of national accounts (ESA 2010 data) with b.o.p./i.i.p. statistics. While increasing accuracy, in general, these revisions have not fundamentally altered the analytical interpretation of the first assessments.
5.1 Current account
In general, revisions to the euro area current account credits and debits were comparable for monthly and quarterly data (see Chart 1) with slightly higher revisions on the debit side. The euro area aggregate recorded revisions comparable with the euro area country median (2% for the quarterly current account credits and debits), with the monthly data showing slightly higher revisions. The euro area as a whole generally revised down its monthly first assessment for imports and exports of goods. This comes as a result of several countries consistently revising down most of their first assessments for both imports and exports: Ireland and France, and export only: Austria[27] and Portugal. With the exception of Ireland, for which the SMAPE for goods is 11% for credits and 5% for debits (see Tables A.1.2.1. and A.1.4.1 in the Statistical Annex), all other countries are recording relatively low relative revisions, that do not cause significant issues in the euro area aggregate. Quarterly data show better results for upward revisions.
Malta, Cyprus[28] and, to a lesser extent, Luxembourg have shown the highest revisions among euro area countries for current account credits and debits (see Chart 1). All three countries generally revised their quarterly current account figures upwards, with directional reliability indicators below the target for Cyprus (for all sub-accounts).
As in previous reports, in terms of current account sub-items, and in particular for monthly data, most countries displayed higher revisions to primary income.
Chart 1
Revisions to current account credits and debits
(symmetric mean absolute percentage error – SMAPE)
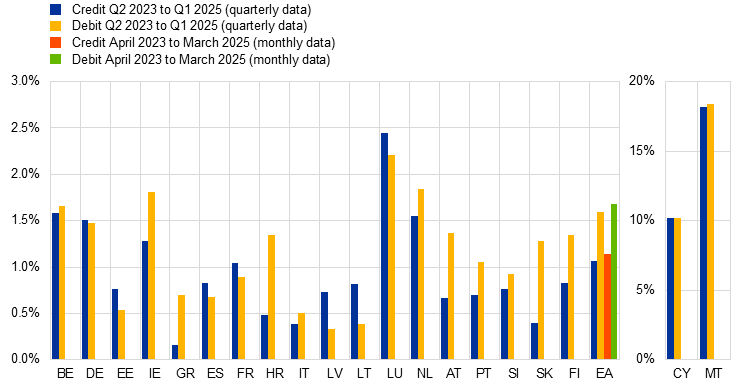
Source: ECB.
Note: The national concept is used for the Goods series.
With regard to revisions to the quarterly current account balance (see Chart 2 below), euro area aggregate revisions were similar to the median of the euro area countries (1%). Monthly revisions were slightly higher than quarterly revisions as assessed by the NRR indicator.
For the current account balance, the most sizeable revisions were recorded by Croatia and Slovakia.
Chart 2
Revisions to the current account balance
(net relative revisions – NRR)

Source: ECB.
Note: The national concept is used for the Goods series.
Detailed information is available in Tables A.1.2.1 to A.1.2.13 in Annex 1 and Annex 2.
5.2 Financial account transactions
For the quarterly euro area aggregate, recorded revisions in financial assets and liabilities amounted to 0.3% of the underlying positions for total transactions, which is slightly higher than the median of euro area countries. Revisions to monthly euro area aggregates were higher (see Chart 3). Monthly revisions to euro area direct investment were the highest: 0.8% for assets and 1% for liabilities, followed by revisions to other investment and portfolio investment, ranging between 0.5% and 0.7%.
Most euro area countries recorded revisions to quarterly financial account transactions of less than 1% of the underlying positions (see Chart 3), the exception being Cyprus (mostly driven by direct investment and, to a lesser extent, by other investment). Croatia also exhibited more revisions on the liabilities side than on the assets side (0.6% and 0.1% respectively), which was mostly driven by other investment. Malta shows revisions of more than 0.5% for both assets and liabilities, mostly driven by portfolio investment and other investment.
In terms of financial account transaction sub-items, in particular for monthly data, most countries displayed equally high revisions to both direct investment and other investment. Other remarkable points include: (i) Ireland not correctly capturing the activity of IFs on a first assessment for monthly data basis, even if source data are available; (ii) The Netherlands has been providing an unreliable monthly first estimate for other investment for both assets and liabilities in other sectors, followed by an improper allocation to the months in the quarter based on the quarterly data.
Chart 3
Revisions to financial account transactions
(mean absolute comparative error – MACE)

Source: ECB.
For net financial account transactions, Croatia recorded the highest level of revisions among euro area countries, followed, to a lesser extent, by Lithuania and Slovakia (see Chart 4).
Chart 4
Revisions to net financial account transactions
(net relative revisions - NRR)

Source: ECB.
Detailed information is available in Tables A.1.2.6 and A.1.2.9 to A.1.2.13 in Annex 1 and Annex 2.
5.3 International investment position
Revisions to the quarterly i.i.p. (financial account positions) for the euro area aggregate (as measured by the SMAPE) were 0.7% for assets and 0.6% for liabilities, the figure for assets being higher than the median for euro area countries while the figure for liabilities was lower (see Charts 5 and 6).
At the country level, revisions to assets and liabilities were generally less than 2%, except in Cyprus, Malta and Croatia (liabilities). In most cases, neither Malta, Croatia (liabilities) nor Cyprus displayed a bias towards upward/downward revisions to their first assessments of the total assets and liabilities positions. In those countries, the directional reliability indicator – for both assets and liabilities – was above or close to 80% (the target value).
Chart 5
Revisions to the international investment position
(symmetric mean absolute percentage error -SMAPE)
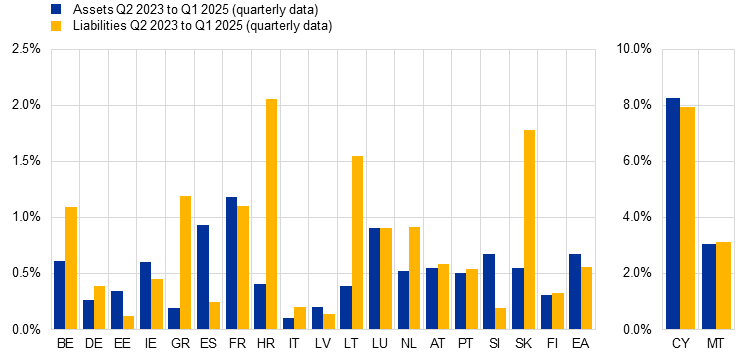
Source: ECB.
The euro area aggregate registered revisions to the net i.i.p. of 0.3% of the underlying average positions during the period under review (lower than the median level of revisions for euro area countries). Among euro area countries, Croatia, Slovakia[29] and Greece stood out in terms of revisions to net i.i.p., with the highest NRR indicators (see Chart 6).
Chart 6
Revisions to the net international investment position
(net relative revisions - NRR)
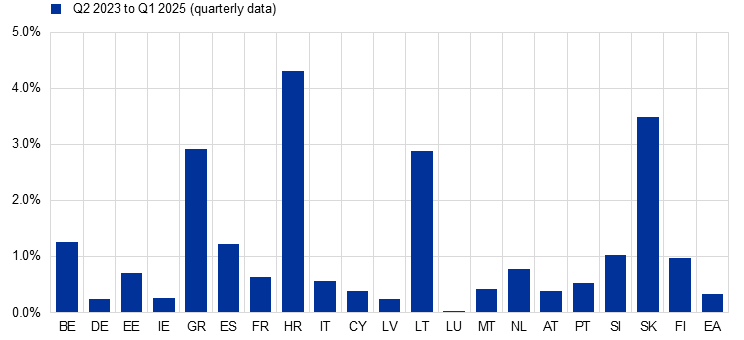
Source: ECB.
Detailed information is available in Tables A.1.2.6 and A.1.2.9 to A.1.2.13 in Annex 1 and Annex 2.
This section assesses the reported national b.o.p. and i.i.p. data for internal coherence and consistency. This comprises consistency over time (i.e. potential breaks in series), consistency across different frequencies (monthly and quarterly data) and an assessment of the arithmetic and accounting identities (including net errors and omissions).
6.1 Validation/integrity rules
This section reviews the extent to which the national datasets transmitted were complete and met all the basic accounting validation rules.[30] These include the linear constraints that apply to the b.o.p., i.i.p. and international reserves template statements, in other words, whether credits/assets minus debits/liabilities match the respective net flows/positions for each item and whether the sub-items add up to the respective items/totals, etc. Furthermore, countries must ensure that datasets for different frequencies (i.e. monthly and quarterly) or data recorded in different datasets (e.g. reserve assets transmitted in the i.i.p. statement and in the reserve assets template) are always kept consistent.
Compliance with the validation rules is assessed based on the “average share of satisfied validations” indicator (see Annex 2 “Methodological documentation for quality indicators” for more details).
Over the period analysed (reference periods: from July 2023 to June 2025, for monthly data, and from Q3 2023 to Q2 2025, for quarterly data), the validation rules for mandatory or agreed series show a high degree of consistency; in cases where data did not pass the required checks, the failed validations were adjusted by the ECB and therefore did not impair the overall quality of the euro area aggregates.
The integrity results are broadly in line with the Quality Report 2023 assessment.
The following countries have the most persistent validation issues.
- Germany has validation issues in the geographical breakdowns (Geo2 and Geo3) for both monthly and quarterly b.o.p. data, stemming from the presence of geographically unallocated amounts. For the time being, there is no plan to allocate those amounts.
- Malta was one of the countries showing several validation issues in quarterly i.i.p. datasets in the Quality Report 2023. Since then, it has made considerable efforts to address these issues, which have for the most part been resolved.
Values for the validation indicators are available in Table A.1.3.1 in Annex 1. The calculations are based exclusively on mandatory and agreed series transmitted to the ECB.
Consistency between datasets is very important to ensure the overall quality of b.o.p. data. The validation issues pertaining to the reconciliation of stocks and flows are used to assess data consistency.
In terms of time consistency, most countries exhibit full consistency between monthly and quarterly data. Occasional discrepancies are present for certain countries, but these do not impact the quality of euro area aggregates.
In terms of reconciliation of stocks and flows, all countries achieved full reconciliation between positions and flows, with the exception of Malta.[31] (See Table A.1.3.1 in Annex 1 for more details).
6.2 Net errors and omissions
Net errors and omissions (the difference between net lending/borrowing as compiled from the current account plus the capital account and the financial account) provide an indication of the internal consistency of the b.o.p. data. In fact, the principle of double-entry bookkeeping means that the sum of all credit and debit transactions should be equal to zero in the b.o.p. statement (i.e. net errors and omissions are zero). Normal random imbalances commonly result from imperfections in source data and/or in compilation practices. However, if these imbalances are large and/or persistent, they indicate problems in sources and/or methods.
With regard to b.o.p. compilation practices, it is not uncommon for statistical modelling and/or expert judgements to be applied with the intention of imposing certain properties on net errors and omissions. This means that statistical techniques are used to address a lack of source data coverage or uncertainty about certain pre-identified items. Such mechanisms are typically incorporated into the compilation system and are applicable during each data production round. At the euro area level, a correction mechanism that minimises net errors and omissions is also in place as part of the process for ensuring the consistency of euro area b.o.p. data and euro area accounts (EAA) statistics. Adjustments made are aimed at keeping absolute net errors and omissions below a threshold broadly corresponding to 1% of euro area quarterly GDP.
The average absolute net errors and omissions relative to average gross current account flows provides a measure of the magnitude of net errors and omissions in comparison with the average gross current account flows. Chart 7 below provides a graphical representation of the situation in euro area countries and shows the euro area aggregate.
Overall, the current results are in line with those presented in the Quality Report 2023.
Owing to the correction mechanism in place, the euro area aggregate did not exhibit high net errors and omissions compared with those of the individual euro area countries. The average relative net errors and omissions for the euro area aggregate was around 2% for monthly data and slightly above 1% for quarterly data.
Quarterly net errors and omissions for euro area countries generally exceeded 2% of the average current account gross flows[32]. Over the period under review (reference period from Q3 2022 to Q2 2025), Finland displayed the highest average net errors and omissions as a percentage of average current account gross flows, at around 8%. Lithuania had the second highest figure among euro area countries, standing at approximately 6%, followed by Germany, with just above 5%. Countries are encouraged to continuously monitor the size of their net errors and omissions and the underlying causes, and to address structural problems as rapidly as possible.
Chart 7
Relative net errors and omissions
(average absolute net errors and omissions relative to average gross current account flows; percentages)
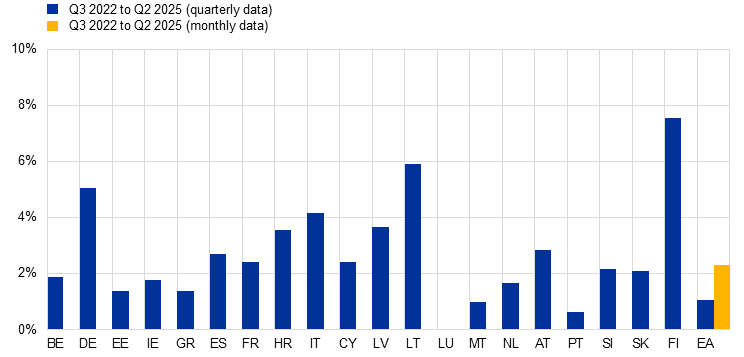
Source: ECB.
The persistence of the sign of net errors and omissions is also relevant as a quality measure, given that it helps to identify biases in the accounts. Chart 8 below shows the cumulative net errors and omissions in relation to current account gross flows.
Chart 8
Bias in net errors and omissions
(cumulative net errors and omissions relative to average gross current account flows; percentages)

Source: ECB.
Neither the euro area aggregate nor the vast majority of euro area countries display a strong statistical bias in their net errors and omissions. However, the bias observed in the net errors and omissions for Latvia, Italy and Cyprus needs to be carefully monitored. Since the last quality report, Finland and Malta have eliminated their bias in net errors and omissions.
External consistency is defined as the coherence of b.o.p. and i.i.p. data with other related statistical domains. In this report, the external consistency/coherence of the b.o.p. and i.i.p. data is assessed against foreign trade statistics, euro area (sector) accounts, MFI BSI statistics – including MMFs –, IVF, SHS and ICPF statistics.
7.1 Coherence with foreign trade statistics
International trade in goods statistics (ITGS) are typically the main data source used to compile the b.o.p. goods account in all euro area countries. However, when comparing the two datasets, significant conceptual differences should be taken into account. Differences in concepts and definitions are linked primarily to the fact that the b.o.p. data follows the “change-of-economic-ownership” principle, whereas the ITGS record physical cross-border movements of goods.[33]
Given the methodological differences between the two datasets, a direct comparison would not convey an accurate picture. Instead, a directional reliability indicator is used to assess whether the b.o.p. and ITGS data exhibit consistent developments and hence can be used as complementary analytical data sources. Furthermore, a few countries publish reconciliation tables between the two datasets, which are available on the websites of their respective NCBs or national statistical institutes (NSIs).
Table A.1.4.1 in Annex 1 shows the individual national directional reliability indicators for the reference period from Q3 2023 to Q2 2025 for the total RoW and extra-euro area counterpart areas. The results are comparable with those presented in the Quality Report 2023.
For the euro area aggregate, there was full directional reliability for both imports and exports.[34] Seven euro area countries displayed directional reliability above 90% for both exports and imports for the two counterpart areas analysed. A limited number of countries showed a lower degree of directional reliability. Generally speaking, data for imports and exports displayed similar reliability indices, with the euro area median being above 90%.
It should be noted that full directional reliability is not necessarily a sign of quality and that inconsistencies in the developments of the two datasets may be explained by the economic structure of the external trade in goods account of the specific country, in particular owing to globalisation-related cross-border production arrangements and merchanting activities linked to large multinational enterprises.
7.2 Consistency with euro area sector accounts
The methodological standards for compiling European b.o.p./i.i.p. and euro area (sector) accounts (EAA) were harmonised with the implementation of the BPM6 and the ESA 2010. Through paragraph 1.6 of the BPM6 and paragraph 18.05 of the ESA 2010, the two manuals aim to ensure conceptual consistency in the recording of an economy’s transactions with the RoW(NA).[35]
However, in practice there are still observed differences in the published figures, for reasons such as a lack of fully harmonised revision policies between the institutions responsible for the compilation of b.o.p./i.i.p. and EAA, the use of different data sources, different compilation methods and different interpretations of the manuals.
Eurostat and the ECB started measuring the degree of actual consistency between b.o.p./i.i.p. and EAA following the introduction of the BPM6 and the ESA 2010 (September 2015). Since January 2022 a single annual report[36] has covered both the financial accounts and the non-financial accounts, using a homogeneous set of indicators and referring to the same time span.[37]
As already highlighted in previous reports, substantial differences remain for a number of countries, resulting in considerable inconsistencies at the EU level. This picture holds despite the implementation of the benchmark revisions in September 2024 by most EU countries[38] which should have resolved (at least a large majority of) these discrepancies. Therefore, it is relevant to continue the regular analysis of consistency between the two domains as well as to strongly encourage countries, especially those contributing the most, to work on the remaining inconsistencies – including for back data – so that they are eliminated or at least significantly reduced.
However, based on the most recent analysis carried out in the autumn of 2025, several euro area[39] countries already exhibited significant relative consistency between the two domains.
- For the current account, four countries (Spain, Finland, Latvia and the Netherlands) currently display fully harmonised b.o.p. and RoW figures, where average discrepancies for the observed period from Q3 2022 to Q2 2025 are below 0.05% of GDP and another eight countries (Austria, Cyprus, Germany, Croatia, Italy, Lithuania, Portugal and Slovenia) achieved a good level of harmonisation with discrepancies of between 0.05% and 0.5% of GDP.
- On the financial account side and for transactions, 13 countries show a consistent picture (i.e. discrepancies below 1% of GDP): Austria, Cyprus, Estonia, Spain, Finland, Croatia, Italy, Latvia, Lithuania, the Netherlands, Portugal, Slovenia and Slovakia.
- On the financial account side and for positions, 14 countries show a consistent picture (i.e. discrepancies below 2% of GDP): Austria, Belgium, Cyprus, Estonia, Spain, Finland, Croatia, Italy, Lithuania, Latvia, the Netherlands (liabilities), Portugal, Slovenia and Slovakia.
Nonetheless, substantial absolute differences remain for the following countries and for selected items of the non-financial and financial accounts that generate the large absolute inconsistencies at euro area level.
- On the current and capital account side: France (goods, services and primary income), Germany (secondary income and capital account), Belgium (goods), Luxembourg (primary income), Malta (primary income) and Slovakia (capital account).
- On the financial account side and for transactions: Germany (“other”),[40]France (“other”) and Ireland (equity and “other”).
- On the financial account side and for positions: Germany (equity and “other”) and France (equity and “other”).
The annual report analyses the current differences between quarterly national b.o.p./i.i.p. and EAA financial and non-financial accounts figures and their evolution as compared with those observed one year ago.[41] Further details can be found in the report available on the CMFB website.
7.3 Coherence with MFI balance sheet item data
Data on cross-border transactions and positions of the euro area MFI sector (deposit-taking corporations and MMFs) are collected and recorded in the b.o.p. and
i.i.p. datasets and under the MFI BSI statistics.
Consistency between b.o.p. data for the MFI sector and transactions in external assets and liabilities derived from the BSI statistics for euro area MFIs is essential for the construction of the “monetary presentation of the balance of payments”[42] and its use for monetary policy purposes. Furthermore, this consistency is also paramount for the compilers of EAA, who use both datasets as “building blocks”. On these grounds, the ECB assesses the consistency between the two datasets in every regular production cycle, taking into account details by geography and instrument. Persistent discrepancies between the two datasets are generally explained by compilation and methodological differences (see below).
The average monthly differences between the two datasets for the euro area aggregate transactions (between July 2022 and June 2025) for other investment instruments (mostly loans and deposits) are smaller in relative and absolute terms than those observed in the Quality Report 2023. In absolute terms, the differences were around €9 billion for assets and €8 billion for liabilities. For holdings of securities, the average monthly discrepancies were also at similar levels in absolute terms for equity (€4 billion) while for debt securities they decreased notably (€6 billion). For quarterly transactions, consistency for loans and deposits has been assured by the ECB since Q1 2013, given that the data are adjusted to be fully consistent with BSI transactions, as part of the process for improving consistency with EAA statistics.
For the euro area countries, monthly transactions were generally consistent across datasets, with a few exceptions in loans and deposits liabilities for Slovakia[43] (4%) and Ireland (3%). Comparability issues in absolute terms were observed for Ireland, with discrepancies amounting on average to around €10 billion for both loans and deposits assets and liabilities. Relative differences in equity assets were relevant for Lithuania (19%), and, in absolute terms, were observed for France, with discrepancies exceeding €8 billion for debt securities assets.
For positions, differences of around €100 billion, i.e. approximately 25% of the average i.i.p., were recorded for euro area equity assets and explained mostly by the French[44] discrepancy of around €80 billion. In addition, Germany, France, Croatia, Cyprus, Latvia, Lithuania, Austria, Portugal[45] and Finland[46] recorded discrepancies exceeding 30% of average positions for equity securities. However, consistency in euro area loans and deposits was almost constant, remaining at the level seen for 2013, owing to the adjustments mentioned above. Changes in the level of consistency are attributable solely to the other flows. However, at the euro area countries level, the largest relative discrepancies were found for Croatia (4% on the assets side and 3% on the liabilities side) while in absolute terms the discrepancy observed for France on the assets side stands out (€60 billion).
The main reasons for these inconsistencies include: (i) differences in the classification of instruments (e.g. an instrument may be classified as a deposit for b.o.p. and i.i.p. purposes, but as remaining assets and liabilities, without the counterpart geographical breakdown, in BSI statistics); (ii) differences in the treatment of short selling of securities in certain countries (off-balance-sheet instead of a reduction in assets); (iii) reliance on distinct data collection systems, namely security-by-security for the b.o.p. data and monthly aggregated sources for BSI statistics, which leads, in particular, to differences in valuation criteria (i.e. the b.o.p. and i.i.p. data are calculated at transaction/market prices, while BSI transactions are derived from positions reported at fair, cost or nominal value, depending on the accounting practices used).
With regard to shares issued by euro area MMFs, at the euro area level, the i.i.p. data frequently exceeded the BSI statistics for outstanding amounts of MMF shares issued by euro area residents and held by non-euro area residents. The average absolute discrepancy reached €126 billion for positions and €13 billion for transactions throughout the period under analysis. At the country level, small discrepancies were recorded in the period under review for France, Luxembourg and Ireland for transactions with non-residents (mostly those countries with relevant MMF activity).
For this particular instrument, the discrepancies between the two sets of statistics are related to the use of different compilation methods in the b.o.p. and i.i.p. datasets and the BSI statistics. While the “residual approach” is used to calculate the b.o.p. and i.i.p. portfolio investment liabilities, MMF liabilities are allocated geographically by respondents in BSI statistics. Although there is, in principle, no significant trading of MMF shares in secondary markets, the intervention of intermediaries buying, holding and selling shares on behalf of their clients can make it difficult to identify the place of residence of the actual holders. In such cases, the first counterpart – the custodian or other intermediary – may be known, but the final investor often is not. Identifying the place of residence becomes increasingly complicated as the length of the chain of intermediaries increases; consequently, the residual approach of the b.o.p. and i.i.p. data may be more accurate.
Further details are available in Charts A.1.4.2 to A.1.4.8 in Annex 1.
Eurosystem
Most of the discrepancies in the data for the Eurosystem aggregate are related to the inclusion in the b.o.p. data of estimates for holdings of euro banknotes outside the euro area,[47] while in BSI statistics all holdings of euro banknotes are deemed to be in circulation in the euro area. Otherwise, the consistency between the b.o.p./i.i.p. and BSI statistics is generally good.
At the country level, the treatment of intra-Eurosystem technical claims is also a source of discrepancies, given that these claims are included in the BSI statistics under remaining assets and liabilities, without a geographical breakdown, and in the b.o.p./i.i.p. data under currency and deposits. Additionally, b.o.p. estimates for holdings of euro banknotes outside the euro area are not included in the BSI statistics.
7.4 Coherence with investment fund statistics
Details of cross-border investments in non-MMF IF shares are recorded in the b.o.p. and i.i.p. statistics under portfolio investment. Data on IF assets and liabilities are collected according to the Regulation on Investment Funds (IF dataset).
At the euro area level, the i.i.p. data consistently exceed the IF dataset in terms of euro area IF shares liabilities. The average absolute discrepancy reached almost €230 billion for positions and €40 billion for transactions throughout the period under analysis (i.e. from Q3 2022 to Q2 2025). The discrepancies at the euro area level are partly explained by the use of the residual approach to calculate portfolio investment liabilities (see the explanation above for MMF shares).
For positions, at the country level, Germany has the highest absolute inconsistency for IF shares held by non-residents (€16 billion). The two datasets are also fairly consistent as regards transactions, with the largest average discrepancies affecting Luxembourg data (€8 billion).
Further details are available in Charts A.1.4.9 to A.1.4.10 in Annex 1.
7.5 Coherence with securities holdings statistics
The ECB Guideline on external statistics specifies that the portfolio investment collection systems of euro area countries must, insofar as possible, rely on security- by-security information (see Annex VI). In particular, it states that “the target coverage is defined as follows: stocks of securities reported to the national compiler on an aggregate basis, i.e. not using standard (international securities identification number (ISIN) or similar) codes, should not exceed 15% of the total portfolio investment stocks of assets or liabilities”. The b.o.p. and i.i.p. statistics and securities holdings statistics by sector (SHSS)[48] are therefore expected to provide consistent results, mainly because national portfolio investment assets and SHSS should derive from the same security-by- security sources of information.[49]
This section compares the positions at market value of (i) debt securities, and (ii) listed shares and IF shares/units, as available in the SHSS dataset.[50] This analysis considers, on the SHSS side, cross-border holdings by residents of each euro area country as collected by the respective country, as well as holdings by non-financial investors of each euro area country that are held in custody in other euro area countries (i.e. “third-party holdings”).
7.5.1 Debt securities
Given the scope of compilation of portfolio investment on a security-by-security basis indicated above, the focus should be on discrepancies that are above 15% of the respective position.
For the euro area aggregate, the level of discrepancies for debt securities was 9% of the underlying i.i.p. data, pointing to a very good level of consistency with SHSS. At the level of individual countries, there were once again no cases of relative discrepancies above 15% owing to SHSS under-coverage.[51]
The main reasons for the differences are the lack of comprehensive coverage of non-ISIN securities data in SHSS, the different revision policies for SHSS and i.i.p. data, the impact of derogations in SHSS and attempts in the i.i.p. statistics to cover securities held with custodians outside the euro area.
Further details are available in Chart A.1.4.11 in Annex 1.
7.5.2 Listed shares and investment funds shares/units
For the euro area aggregate, the total discrepancy as a percentage of the underlying i.i.p. data was 4%. At the country level, discrepancies above the 15% threshold owing to SHSS under-coverage were recorded in France, Croatia (SHSS over-coverage from Q1 2023 onwards), Italy[52],Cyprus (SHSS over-coverage before Q1 2023) and Malta.[53] It is worth mentioning the improvement observed in i.i.p. assets with regard to the amounts held by German financial institutions excluding MFIs.
The caveats mentioned for debt securities mostly hold true when explaining this discrepancy. In addition, it is worth noting the impact of different market price estimates between both domains. Further details are available in Chart A.1.4.12 in Annex 1.
7.6 Coherence with insurance corporation and pension fund statistics
Following the update of the ECB Guideline on external statistics, quarterly information on transactions, positions and other flows for ICPF became available. These new details make it possible to compare the data collected under the Regulations on insurance corporations[54] (IC dataset) and pension funds[55] (PF dataset). On the asset side,[56] the comparison is relatively comprehensive, while from the liabilities perspective only selected instruments in the IC and PF datasets include a cross-border breakdown. Consequently, the analysis here focuses solely on the asset side and relates to transactions and positions.
At the euro area level, the relative discrepancies are very low for both transactions and positions, reflecting a high level of consistency between the datasets. The average absolute discrepancy reached €7 billion for transactions and €31 billion for positions.
At the country level, for transactions, the relative discrepancies are, in general, relatively low. Malta has the largest difference (2%), while Ireland has the highest in absolute terms (€6 billion). For positions, notable relative inconsistencies above 10% are observed in Germany, Estonia, Ireland and France. In absolute terms, the largest discrepancies are for Germany and France[57] (€124 billion and €115 billion respectively) and are linked mostly to equity instruments.
Further details are available in Charts A.1.4.13 to A.1.4.14 in Annex 1.
Asymmetries are an inherent feature of all statistics for which “mirror” data are collected, i.e. for which two countries collect the same type of information in relation to each other. They occur when one country’s data do not correspond to the data for the same transaction reported by its partner country. However, for a variety of reasons, it is rarely the case that two data sources provide exactly the same results, and this leads to asymmetries.
Asymmetries can be observed at the level of the global economy (where total world assets should equal total world liabilities), at the level of geographical aggregates (where total intra-euro area assets should match total intra-euro area liabilities) and at the level of bilateral pairs (where flows and positions between pairs of countries should match perfectly).
8.1 Intra-euro area asymmetries
Charts 9 and 10 provide an overview of intra-euro area asymmetries in the current and capital accounts and the financial account respectively.
Chart 9
Intra-euro area current and capital account asymmetries
(EUR billions)
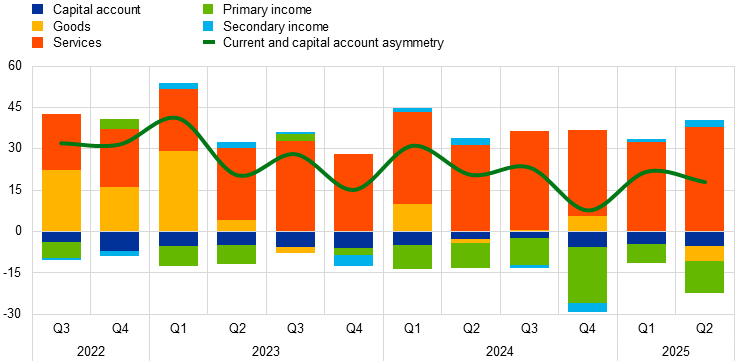
Source: ECB.
Current and capital account asymmetries (credits minus debits) were always positive over the period under review. The value of such asymmetries showed a slightly declining trend over the period analysed (from around €30 billion to around €20 billion), mostly owing to lower asymmetries in goods[58] and larger but compensating negative asymmetries in primary income. Asymmetries in services remained large and were always positive, showing that intra-euro area exports of services are larger than the corresponding imports. Secondary income and capital accounts only contributed to overall asymmetries in particular quarters.
Chart 10
Intra-euro area financial account asymmetries
(EUR billions)
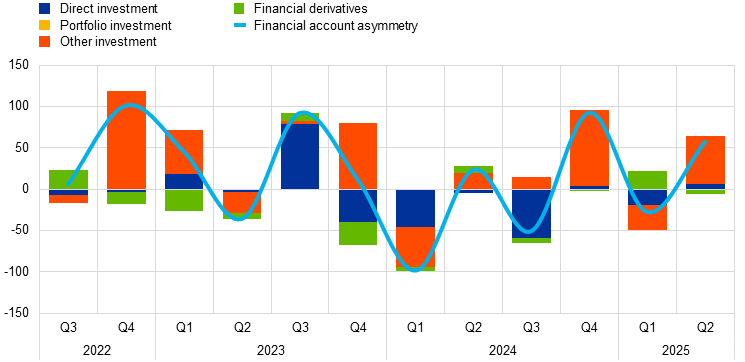
Source: ECB.
In the financial account, asymmetries were recorded mainly for direct and other investment. Portfolio investment and related income do not show asymmetries by construction, owing to the residual compilation approach at the euro area level. Asymmetries for financial derivatives were substantial only in specific quarters. Financial account asymmetries were fairly volatile over the period under review, ranging from €100 billion to -€100 billion with large asymmetries for direct and other investment mostly contributing in the same direction to the overall asymmetry. Asymmetries for other investment were the main contributor to the overall financial account asymmetry in most quarters, reaching seasonally very large values in the last quarter of the year (where they were always around €100 billion). Currency and deposits contributed to the large size of asymmetries in other investment in most quarters, while loans and trade credits contributed substantially only in specific quarters. Asymmetries for FDI transactions are regularly discussed and addressed in the context of the FDI ARM.
8.2 Bilateral asymmetries
Following the update of the ECB Guideline on external statistics, quarterly bilateral transactions and positions between euro area countries are now transmitted to the ECB on a mandatory basis for several b.o.p. categories and instruments.
The relevance indicator (RELV) shows the relevance of the asymmetries involving a certain country for the total intragroup asymmetries, thus indicating how much a country is involved, either as the reporting country or counterparty country, in intragroup asymmetries. More information on these indicators can be found in the statistical paper series: Using synthetic indicators to assess the quality of macroeconomic statistics via mirror data (paper).
The results of the RELV indicator for the current account (see Chart 11) for the period from Q3 2022 to Q2 2025 show that Germany, the Netherlands and Belgium, either as the reporting country or counterparty country, contribute most to intra-euro area current account asymmetries. While Germany is very relevant for intra-euro area asymmetries in both goods and services, the Netherlands is mostly relevant for asymmetries in goods and FDI income, while for Belgium it is mostly asymmetries in goods that matter. The relevance of these three countries was also similar in the period from Q3 2019 to Q2 2022 (with some improvements observed in the most recent period for Germany and the Netherlands).
Chart 11
RELV indicator for current and capital account transactions, mean values
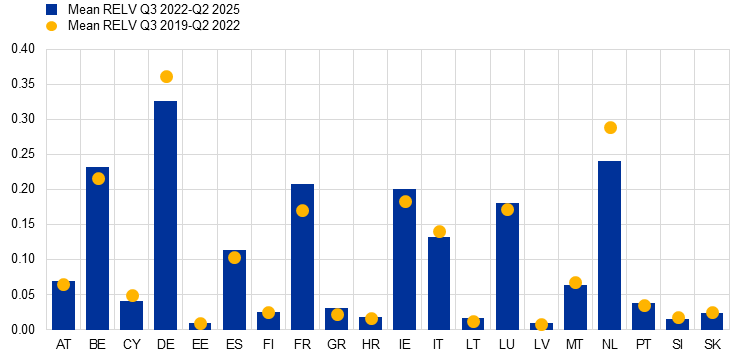
Source: ECB.
Note: The measure of the current account shown in this chart does not include data for portfolio investment income as no bilateral data on the debit side are available
The results of the RELV indicator for financial account transactions (see Chart 12) for the period from Q3 2022 to Q2 2025 show that France, Luxembourg, Ireland, the Netherlands and Germany, either as the reporting country or counterparty country, contribute most to intra-euro area financial account asymmetries. While France and Germany stand out largely for their contribution to asymmetries in other investment, Ireland, the Netherlands and Luxembourg contribute to most of the intragroup asymmetries in FDI. The relevance of these countries was largely the same as in the period from Q3 2019 to Q2 2022 (with some improvements in the most recent period for Luxembourg and the Netherlands).
Chart 12
RELV indicator for financial account transactions, mean values

Source: ECB.
Note: The measure of the financial account shown in this chart does not include data for portfolio investment (by construction, asymmetries are zero) and financial derivatives (no bilateral data are available).
Box 1
Bilateral asymmetries in other investment
Intra-euro area asymmetries in financial account transactions were strongly affected by asymmetries in other investment (OI) (as shown in Chart A). This box presents the results of the synthetic quality indicators for other investment.[59]
The internal country geographical quality (ICGQ) and external country geographical quality (XCGQ) indicators measure the quality of the geographical breakdown. The ICGQ indicator assesses the accuracy of individual countries’ geographical classification within the sample of countries for which bilateral data are available by aggregating absolute bilateral asymmetries. The XCGQ indicator shows how well a country’s reported intra-euro area aggregate matches its mirror data, calculating the difference between the intra-euro area figure reported by the country under consideration and the corresponding figure derived from counterpart data. The relevance indicator (RELV) shows the relevance of the asymmetries involving a certain country for the total intragroup asymmetries. More information on these indicators can be found in Annex 2 to this report.
The results of the RELV indicator for OI transactions show that France and Germany, either as the reporting country or counterparty country, contribute the most to bilateral asymmetries. They are followed by the Netherlands, Luxembourg and Ireland as the next most relevant countries for intra-euro area asymmetries in OI transactions.
The results of the ICGQ indicator for OI transactions show Malta and Cyprus recorded high scores, indicating structural problems in matching counterparts’ bilateral transactions. Lithuania, Greece, Estonia, Luxembourg, Finland and Ireland also showed quite high values for this indicator (above 0.5).
The results for the XCGQ indicator were generally better than those recorded for the ICGQ indicator, given that the former is less about matching up individual country counterparts and merely measures how well the counterparts as a group match a country’s estimate for that group. Consequently, all countries performed relatively well. This finding is welcome from the point of view of the quality of overall euro area data. Malta, Lithuania, Luxembourg and Greece scored worse in this indicator.
Chart A
RELV indicator for other investment transactions, mean values
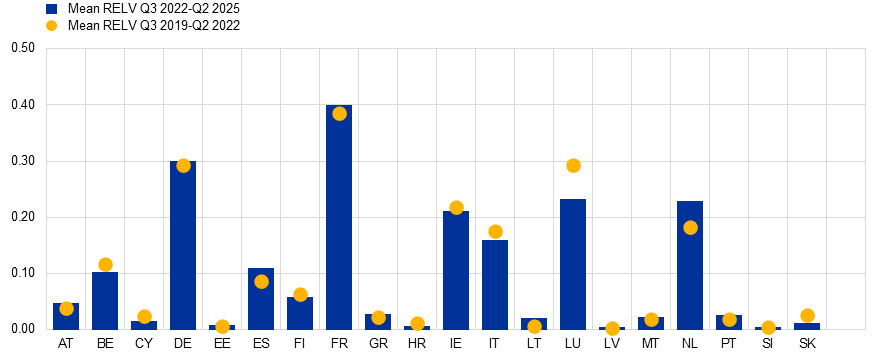
Source: ECB.
Chart B
ICGQ indicator for other investment transactions, mean values
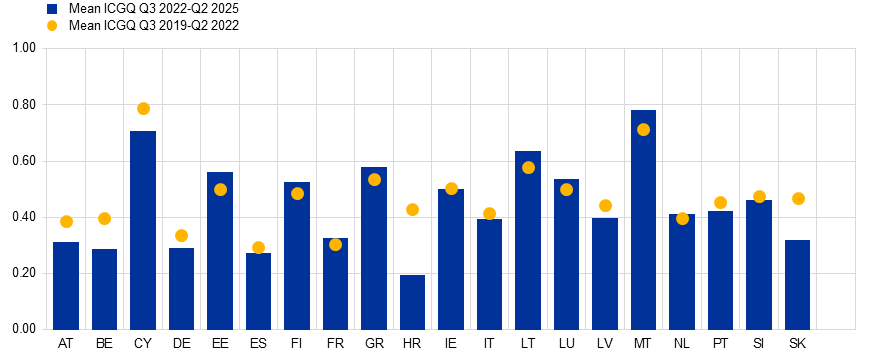
Source: ECB.
Chart C
XCGQ indicator for other investment transactions, mean values
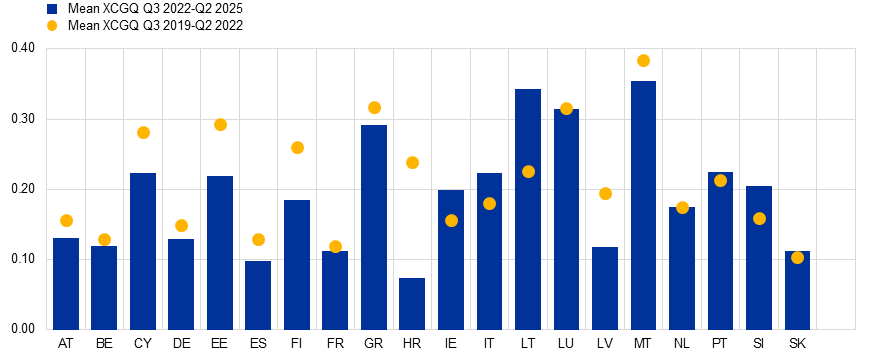
Source: ECB.
See more.
© European Central Bank, 2026
Postal address 60640 Frankfurt am Main, Germany
Telephone +49 69 1344 0
Website www.ecb.europa.eu
All rights reserved. Reproduction for educational and non-commercial purposes is permitted provided that the source is acknowledged.
For specific terminology please refer to the ECB glossary (available in English only).
PDF ISBN 978-92-899-7890-3, ISSN 1830-3439, doi:10.2866/5151856, QB-01-26-135-EN-N
HTML ISBN 978-92-899-7889-7, ISSN 1830-3439, doi:10.2866/7034725, QB-01-26-135-EN-Q
Legal Disclaimer:
EIN Presswire provides this news content "as is" without warranty of any kind. We do not accept any responsibility or liability for the accuracy, content, images, videos, licenses, completeness, legality, or reliability of the information contained in this article. If you have any complaints or copyright issues related to this article, kindly contact the author above.
